平均電力1のQAM信号を生成するC++のソースコードでも使用したHTMLにコンスタレーションを表示するためのデバッグツールです。![]() qam.zipに同梱されています。
qam.zipに同梱されています。
自分のプログラムへの組み込み方 †
プログラム開始時にopen_graph_constellation()を呼んでコンスタレーションに表示したい信号をgraph_constellation(s)で追加して行ってプログラム終了時に close_graph_constellation()を呼ぶだけです。↓な感じ。
  open_graph_constellation();
  for(int i = 0; i < n; i++){
    for(int j = 0; j < n; j++){
      printf("%f,%f\n", qam[i][j].real(), qam[i][j].imag());
      graph_constellation(qam[i][j]);
    }
  }
  close_graph_constellation();
↑は行列qamに入っている値をプロットする処理です。
サンプルプログラムの動かし方 †
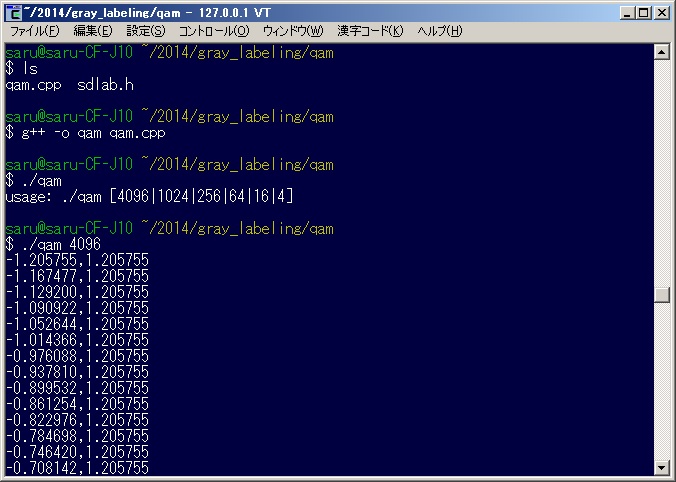
![]() ソースコードをここからダウンロードします。解凍してコンパイルして引数にQAMの信号点を指定すれば動作します。実行するとconstellation.htmlというファイルを吐いてJavaScript + camvusで信号点を可視化するように作ってあります。平均電力1のQAM信号を生成するC++のソースコードではQPSKだったので今度は4096QAMで試すと↓な感じです。
ソースコードをここからダウンロードします。解凍してコンパイルして引数にQAMの信号点を指定すれば動作します。実行するとconstellation.htmlというファイルを吐いてJavaScript + camvusで信号点を可視化するように作ってあります。平均電力1のQAM信号を生成するC++のソースコードではQPSKだったので今度は4096QAMで試すと↓な感じです。
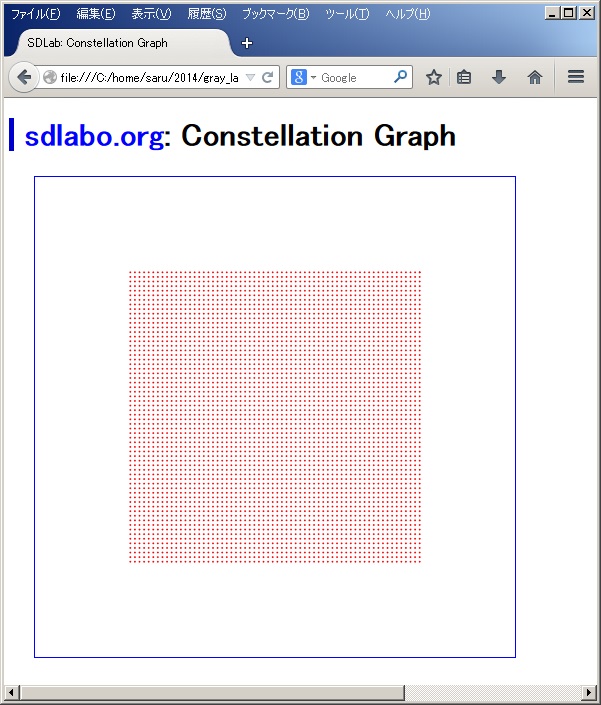
constellation.htmlを開くと↓な感じです。
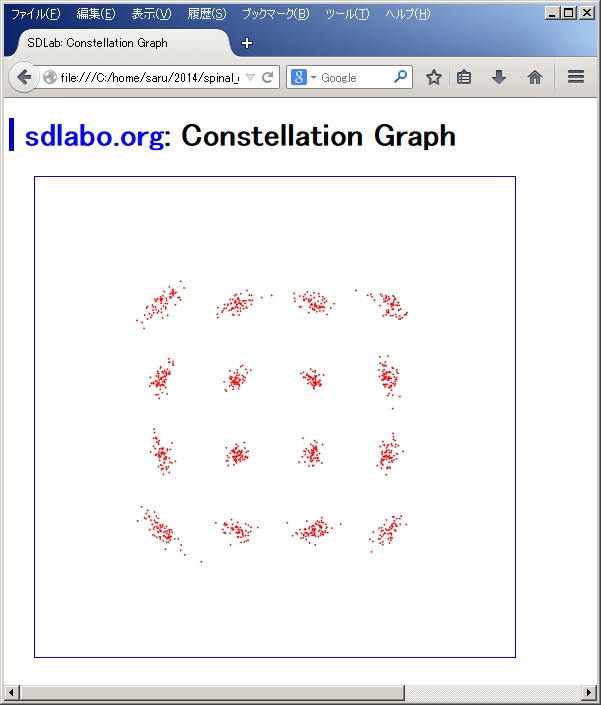
16QAMの光通信の処理をこのツールでプロットしてあげると↓な感じになります。量子雑音で信号点の位相が回転しているのが見えます。
HTMLのソースコードの一部を見せると↓な感じ。そんなに複雑なことはしていないです。
<script type="text/javascript">

var ctx_iq;

onload = function() {
  canvas_iq = document.getElementById('canvas_iq');
  ctx_iq = canvas_iq.getContext('2d');
  var str_iq = "[[1,1],[1,-1],[-1,1][-1,-1],[0,0]]";
  data_iq = JSON.parse(str_iq);
  plotDot(ctx_iq, data_iq, 'rgb(255, 0, 0)');
};

function plotDot(ctx, data, color)
{
  var x, y, len;
  ctx.strokeStyle = color;
  ctx.clearRect(0, 0, 480, 480);
  y = data[0][0] * 120 + 240;
  x = data[1][1] * 120 + 240;
  len = data.length;

  ctx.beginPath();
  ctx.arc(x, y, 0.5, 0, Math.PI * 2, false);
  ctx.stroke();

  step = 1000 / (len - 1);

  for(i = 0; i < len - 1; i++){
    x = data[i][0] * 120 + 240;
    y = data[i][1] * 120 + 240;
    ctx.beginPath();
    ctx.arc(x, y, 0.5, 0, Math.PI * 2, false);
    ctx.stroke();
  }
}

</script>
</head>
<body>
  <h1><a href="http://www.sdlabo.org/">sdlabo.org</a>: Constellation Graph</h1>
  <div id="main">
    <canvas id="canvas_iq" width="480px" height="480px"></canvas>
  </div>
</body>


